DTC e-commerce · Profit audit case study
€40,820 in misallocated capital, surfaced on an eight-page audit.
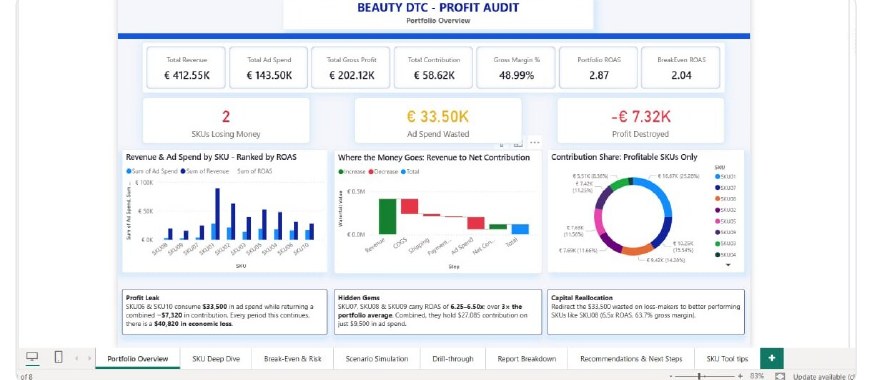
A Power BI profit audit on a simulated DTC beauty brand doing €412.55K in annual revenue across 10 SKUs. The work is a methodology demonstration on synthetic Shopify-tier data, not an anonymised client report. The depth, the modelling, and the structure are identical to client work.
What the audit surfaced
The brand was profitable on paper. The audit pulled the profitability apart at SKU and channel level and showed where the headline number was hiding three separate problems.
-
€40,820 misallocated capital
Two SKUs consumed €33,500 in ad spend while returning a combined −€7,320 in contribution. The audit sized the leak against a do-nothing-but-pause baseline and produced a reallocation recommendation to the highest-ROAS SKUs.
-
2 of 10 SKUs · structurally loss-making
Two SKUs were burning ad budget on negative contribution at current unit economics. Three accessory SKUs, the actual profit engine, were receiving 6.6% of the marketing budget while generating 41% of profitable contribution.
-
+44% modelled contribution uplift, no new product
The scenario simulator combined pausing the loss-makers with a 10% COGS reduction and a 20% ROAS improvement to model an estimated +€26,000 contribution uplift. All measure-driven, all re-runnable on next month's data.
What is inside the .pbix
The architecture is what makes the findings hold up under pressure. None of the recommendations rely on a single chart. Each one is tied to a measure that can be re-run on next month's data without rebuilding anything.
- Disconnected dimension tables
Waterfall steps modelled as a disconnected dimension to route shared measures without breaking the relational integrity of the fact tables.
- VAR-driven contribution margin
Contribution margin built with VAR blocks to avoid circular dependency on the ROAS measure. Standard DAX pattern, applied correctly.
- Three live what-if parameters
COGS shift, ROAS shift, and channel allocation shift driving live simulated contribution across the portfolio. Slider-driven, not hard-coded.
- Drill-through page
Raw[SKU] in the field well so you can right-click any SKU in any chart and land on a dedicated detail page with the full unit-economics breakdown.
- Tooltip canvas page
A canvas page registered as a tooltip, so hovering on a SKU in the headline chart surfaces the contribution margin, return rate, and last-week movement without leaving the page.
The full PDF
Six pages, eight figures, a full DAX methodology appendix, and the four recommendations the audit produced. Read it for the framework, not the numbers.
Want this depth applied to your data?
Book a free fifteen-minute diagnostic call. Bring one report you currently use to make a decision. I will tell you what is missing from it.