Logistics and 3PL · Performance audit case study
A 25.20% return rate hidden inside a 45.54% margin business.
A Power BI audit on a pan-European e-commerce operation across 20 countries, 5 carriers, and 10 product lines. €204.7K in sales across 1,000 orders. The headline profit margin looked healthy. One in four parcels was coming back, and the return rate spread across countries reached 23 percentage points. The audit isolated where and produced a country-level carrier reallocation plan.
What the audit surfaced
Logistics dashboards usually conflate speed and performance. The audit separated the two and showed which carrier was actually costing money once returns were priced in.
-
GLS 31.91% vs PostNL 21.96% · same speed band
GLS carried the highest return rate in the network at 31.91%, despite a competitive 3.96-day average delivery time. PostNL sat at 21.96% with a comparable service level. Speed was not the issue. Handling, packaging, or last-mile execution was the most likely cause and the highest-impact place to investigate first.
-
23-point country spread · 15.52% to 38.89%
Country-level return rates ranged from 15.52% in Sweden to 38.89% in Romania. Romania alone runs at more than 2x the lowest country in the network. Reallocating Romanian volume to UPS, which already covers Eastern Europe, was the single highest-leverage carrier change available.
-
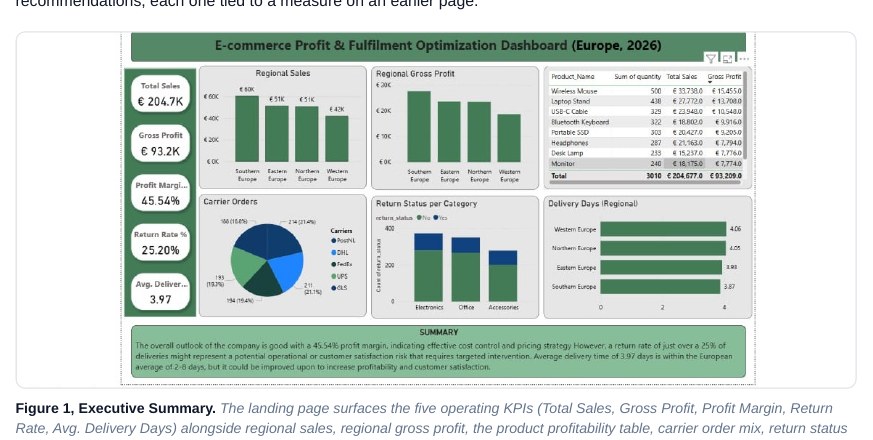
Five operating KPIs on one page
Total sales, gross profit, profit margin, return rate, and average delivery days surfaced on a single executive page alongside regional sales, regional gross profit, the product profitability table, carrier order mix, return status by category, and average delivery days per region.
What is inside the .pbix
The report is structured as a top-down narrative. Page one sets the headline picture. Pages two and three isolate the product and profitability story. Pages four and five isolate the logistics and carrier story. Page six closes with five concrete recommendations, each one tied to a measure on an earlier page.
- Multi-carrier benchmarking
Carrier performance separated from regional performance, then layered together so the interaction effects become visible. No carrier looks bad on its own. The network view shows where it actually drags.
- Return-rate isolation
Return rate decomposed across SKU, carrier, region, and category, so the audit could point to the specific intersection driving the headline number rather than blaming a single dimension.
- Margin-by-channel decomposition
Profitability framed at portfolio, region, product, and carrier level so the audit could show which combinations were profitable on a fully-loaded basis and which were not.
The full PDF
Six pages, twelve figures, and five recommendations. Read it for the framework, not the numbers.
Multiple carriers and patchy visibility?
Book a free fifteen-minute diagnostic call. Bring one report you currently use to make a decision. I will tell you what is missing from it.